PowerQuery and PowerPivot, the two new powerful features for the latest Excel
You are a proficient Microsoft Excel user – vlookup is an appetizer, pivot-table is the main course, and VBA/Macro is your dessert. And your company just gave you an upgraded Microsoft 365 subscription, and a brand new version of Excel is just being served. You are wondering – “What’s new?”
As an analyst living and breathing with Excel, PowerPivot and PowerQuery are the two killer features, period. I’d like to share my story on how you can save time and make your spreadsheet work more efficient.
What are PowerPivot and PowerQuery
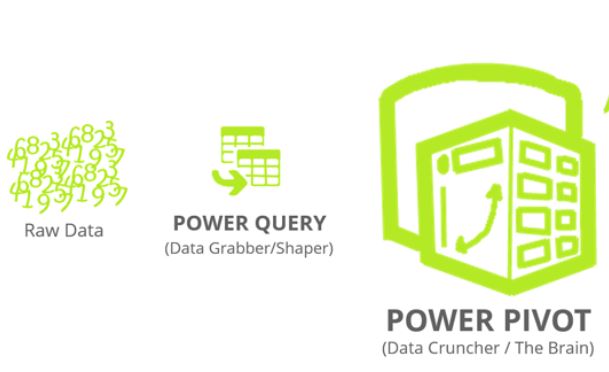
is essentially a supercharged pivot table. It looks and feels the same as the regular Excel Pivot table. Under the hood, it is powered by “DAX” , similar but more powerful excel formula language used to create calculated measure(eg: F=a+b, usually numeric), and calculated columns (eg: F = “a” & “b” , usually non-numeric).
is a self-serving ETL tool for data-savvy business users. It is commonly referred as “clean the data”. Traditionally, large scale ETL process is handled by corporate IT or business intelligence department, while small scale ETL happened almost every day: Copy and past, change format, rename the columns across multiple sheets in an excel file. Power Query sits in the middle, it allows users who are not afraid of getting their feet wet to automate their data cleaning process, without the need of writing programming code.
Both of them are free to use in Excel 2016 and Excel 365.
Why and how I started to use them
Power Pivot came to me in late 2014. At the time pivot table was my best friend to slice and dice the data. Knowing Microsoft made an engine upgrade to it attracted me. I had a project at the time, to merge data from more than 3 difference sources to build a dashboard, so I bought the only book in the market at the time and dived in.
I finished the project in 2 months, and had my foot in the door of PowerPivot. The tool itself was “okay” to use, but its potential was apparent with the massive excel user base all over the world.
The tool got better to use, and the community grew much bigger as well over the past few years. But this is really how everything started for me.
What I like and what I don’t like
Fast forward 3 years, I have built about 10 different data models using PowerPivot, and adding Power Query into the portfolio is huge. To me, PowerPivot is nice to have (main features can be substituted by “vlookup” and other excel formula), but Power Query is a must have. I wasn’t in IT department and the corporate ETL tool was not available to me. Writing VBA script wasn’t my taste either.
Power Query had a face-lift in Excel 2016 – it is now called “Get and Transform Data”
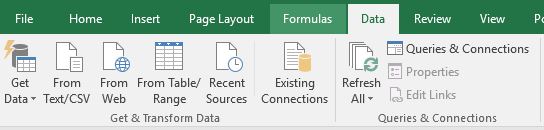
The tool itself also shares almost the same user interface with PowerBI Desktop, which I have written a previous blog for its dashboarding capabilities. I applause this move by Microsoft for making analyst like me switching platform effortlessly.
A side note on PowerBI, the ease of copy and paste numbers & chart could be the hurdle preventing its adaptation to the next level. It looks cool and fancy to executives. But for tactical frontline marketers or sales professionals who care about raws numbers, it is much less manipulative than a PowerPivot table.
What I don’t like is Microsoft “invented” two programming languages for each of them. DAX is the one for PowerPivot, and M is for PowerQuery. A lot of function can be performed in both two languages, for examples adding a new column using calculation. Therefore it could lead to misleading particularly for a new user.
Case study – Using Power Query + Power Pivot to automate Amazon paid search campaign report
Amazon Marketing Service(AMS) was recently launched in Canada in Q4 2017, and its reporting feature is limited. We believe it will eventually get better over time, however in the interim we need to get the metrics and result out of its system in a reliable way, in order to empower the marketer who owns this platform and budget making decisions and adjustment based on data.
It is a 2-month project, and also my 1st time actively applying agile principle – get a minimum viable product out quickly (in 2 wks), and making an adjustment based on changing business need and new technical challenges.
The data structure has medium level complexity. It can be broken down into 3 level
- Account
- Campaign
- Keyword
The metrics Amazon provided are relatively straightforward: dollar spend, budget, impressions, clicks, attributed sales, ACoS(Avg Cost of Sales), CTR(Click Thru Rate), CPC(Cost per click).
Without using PowerPivot and Power Query, we were only able to download the account level and perform a manual summary in the spreadsheet. Campaign and keyword level became too tedious.
Power Query to clean and prepare the data
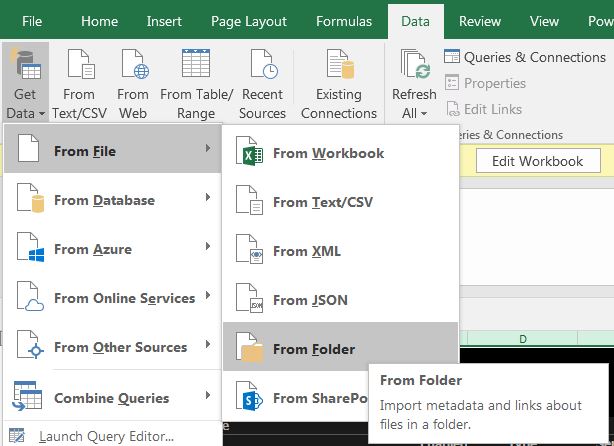
Using Power Query, we were able to automate loading more than 60 different CSV file local data source. In our case, we have 3 accounts X 20 Campaigns, and two out of three campaign types in Amazon has keyword level metrics (Sponsor Products, Headline Search).
Specifically, we need to make sure the file downloaded from Amazon are using the same naming convention and stored in the same folder. This part still requires a real person downloading files from Amazon – we have not received API access yet.
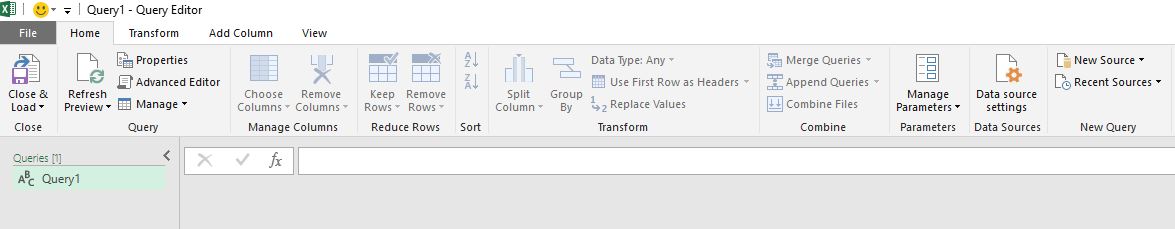
Then we use “load data” from a folder, and built 2 layers of data model in Power Query :
- Load CSV in the same folder to the same table
- Strip out file name and use it as a column to differentiate brands
- Change column name and field type
The main output of Power Query is 3 tables (instead of 60 files), cleaned and ready to analyze.
Power Pivot to created calculated metrics and pivot table structure
The 2nd part is much less complicated. Following three steps are performed:
- Adding a new table to create hierarchy for data slicing
- Create data connection in the map view
- Adding three calculated metrics (Click thru rate, ACoS, ROAS)
The 3rd step is easy to be neglected – as those calculated metrics are actually provided by Amazon and we ended up not using it and create our own. The reason? When using customized time period, the Power of DAX will automatically re-calculated, instead of by default using summary or average.
My recommended learning material:
- Book
- Video training :
- SQL BI: https://www.sqlbi.com/
- Community:
- Official platform: http://community.powerbi.com/
- My personal favourate 3rd party one: https://powerpivotpro.com/
Sue - would be grateful if you could also link our website up to this useful article.
Excellent sharing thank you so much for the well- explained relationship between Power Query & Power BI.