Measure camp 2025, a renowned community-based worldwide event in digital analytics, took place at Humber College’s downtown Toronto campus on Saturday, October 4th. This marks the second year of the event’s Toronto location. The organizers, including Jose, Marc, James, and Melissa, along with Humber College students, supported the event. The full agenda is available here.
This unique “camp” format eliminates keynote speakers, instead encouraging participants to propose topics and present or facilitate them in a workshop-like format.. The camp features multiple rooms, allowing participants to join events based on their interests. Attendance is free, and food is provided (in Toronto, sponsored by the organizer). The conference is always held on Saturdays, attracting enthusiastic participants.
I’ve been attending industry events in digital analytics and measurement field since 2017. Measure Camp is the natural evolution of eMetrics and Digital Analytics Association, with its clear mandate of “knowledge transfer” in an open environment. While keynote speaking may not suit everyone, I believe everyone has valuable insights to share, and the format is most welcoming.
This holiday I got another tech toy – an M1 powered MacBook Pro 13”. One of the reasons to justify my buying decision is I will be able to “produce” more tennis tracking videos using the Mac version of the SwingVision. In this post, I’d like to share my initial review of it, after using it for a couple of sessions.
In a normal situation, I would wait for a few more weeks to get a bit more hands-on experience. Unfortunately, the city I live in imposed a new lock-down measure, essentially blocking any indoor tennis over the winter. The plan is to keep updating this with more information available.
Key takeaways & recommendations
SwingVision on Mac is a working version that can analyze video captured from any recording device with a minimum of 720p and 30fps.
The convenience of viewing and editing the video on a bigger screen with a Mac provides a better user experience.
The post-game editing feature is still limited since SwingVision doesn’t allow for exporting video in the Mac for now. However, it doesn’t limit any video edit by tools like iMovie to pre-process the imported video
If you are an apple watch user to tag the game with real-time scoring, I don’t suggest you wait a bit. The current combination will result in losing the real-time scoring capabilities since the video and the watch stats isn’t talking to each other.
This is my #2 post on tennis video analyzing, #6 post on using Apple Watch to track tennis performance, and #11 post on sports in general.
The coronavirus pandemic isn’t over yet, but at least recreation tennis is back. The city I live in have allowed for tennis activity since late May, and I have been play a lot of tennis since then.
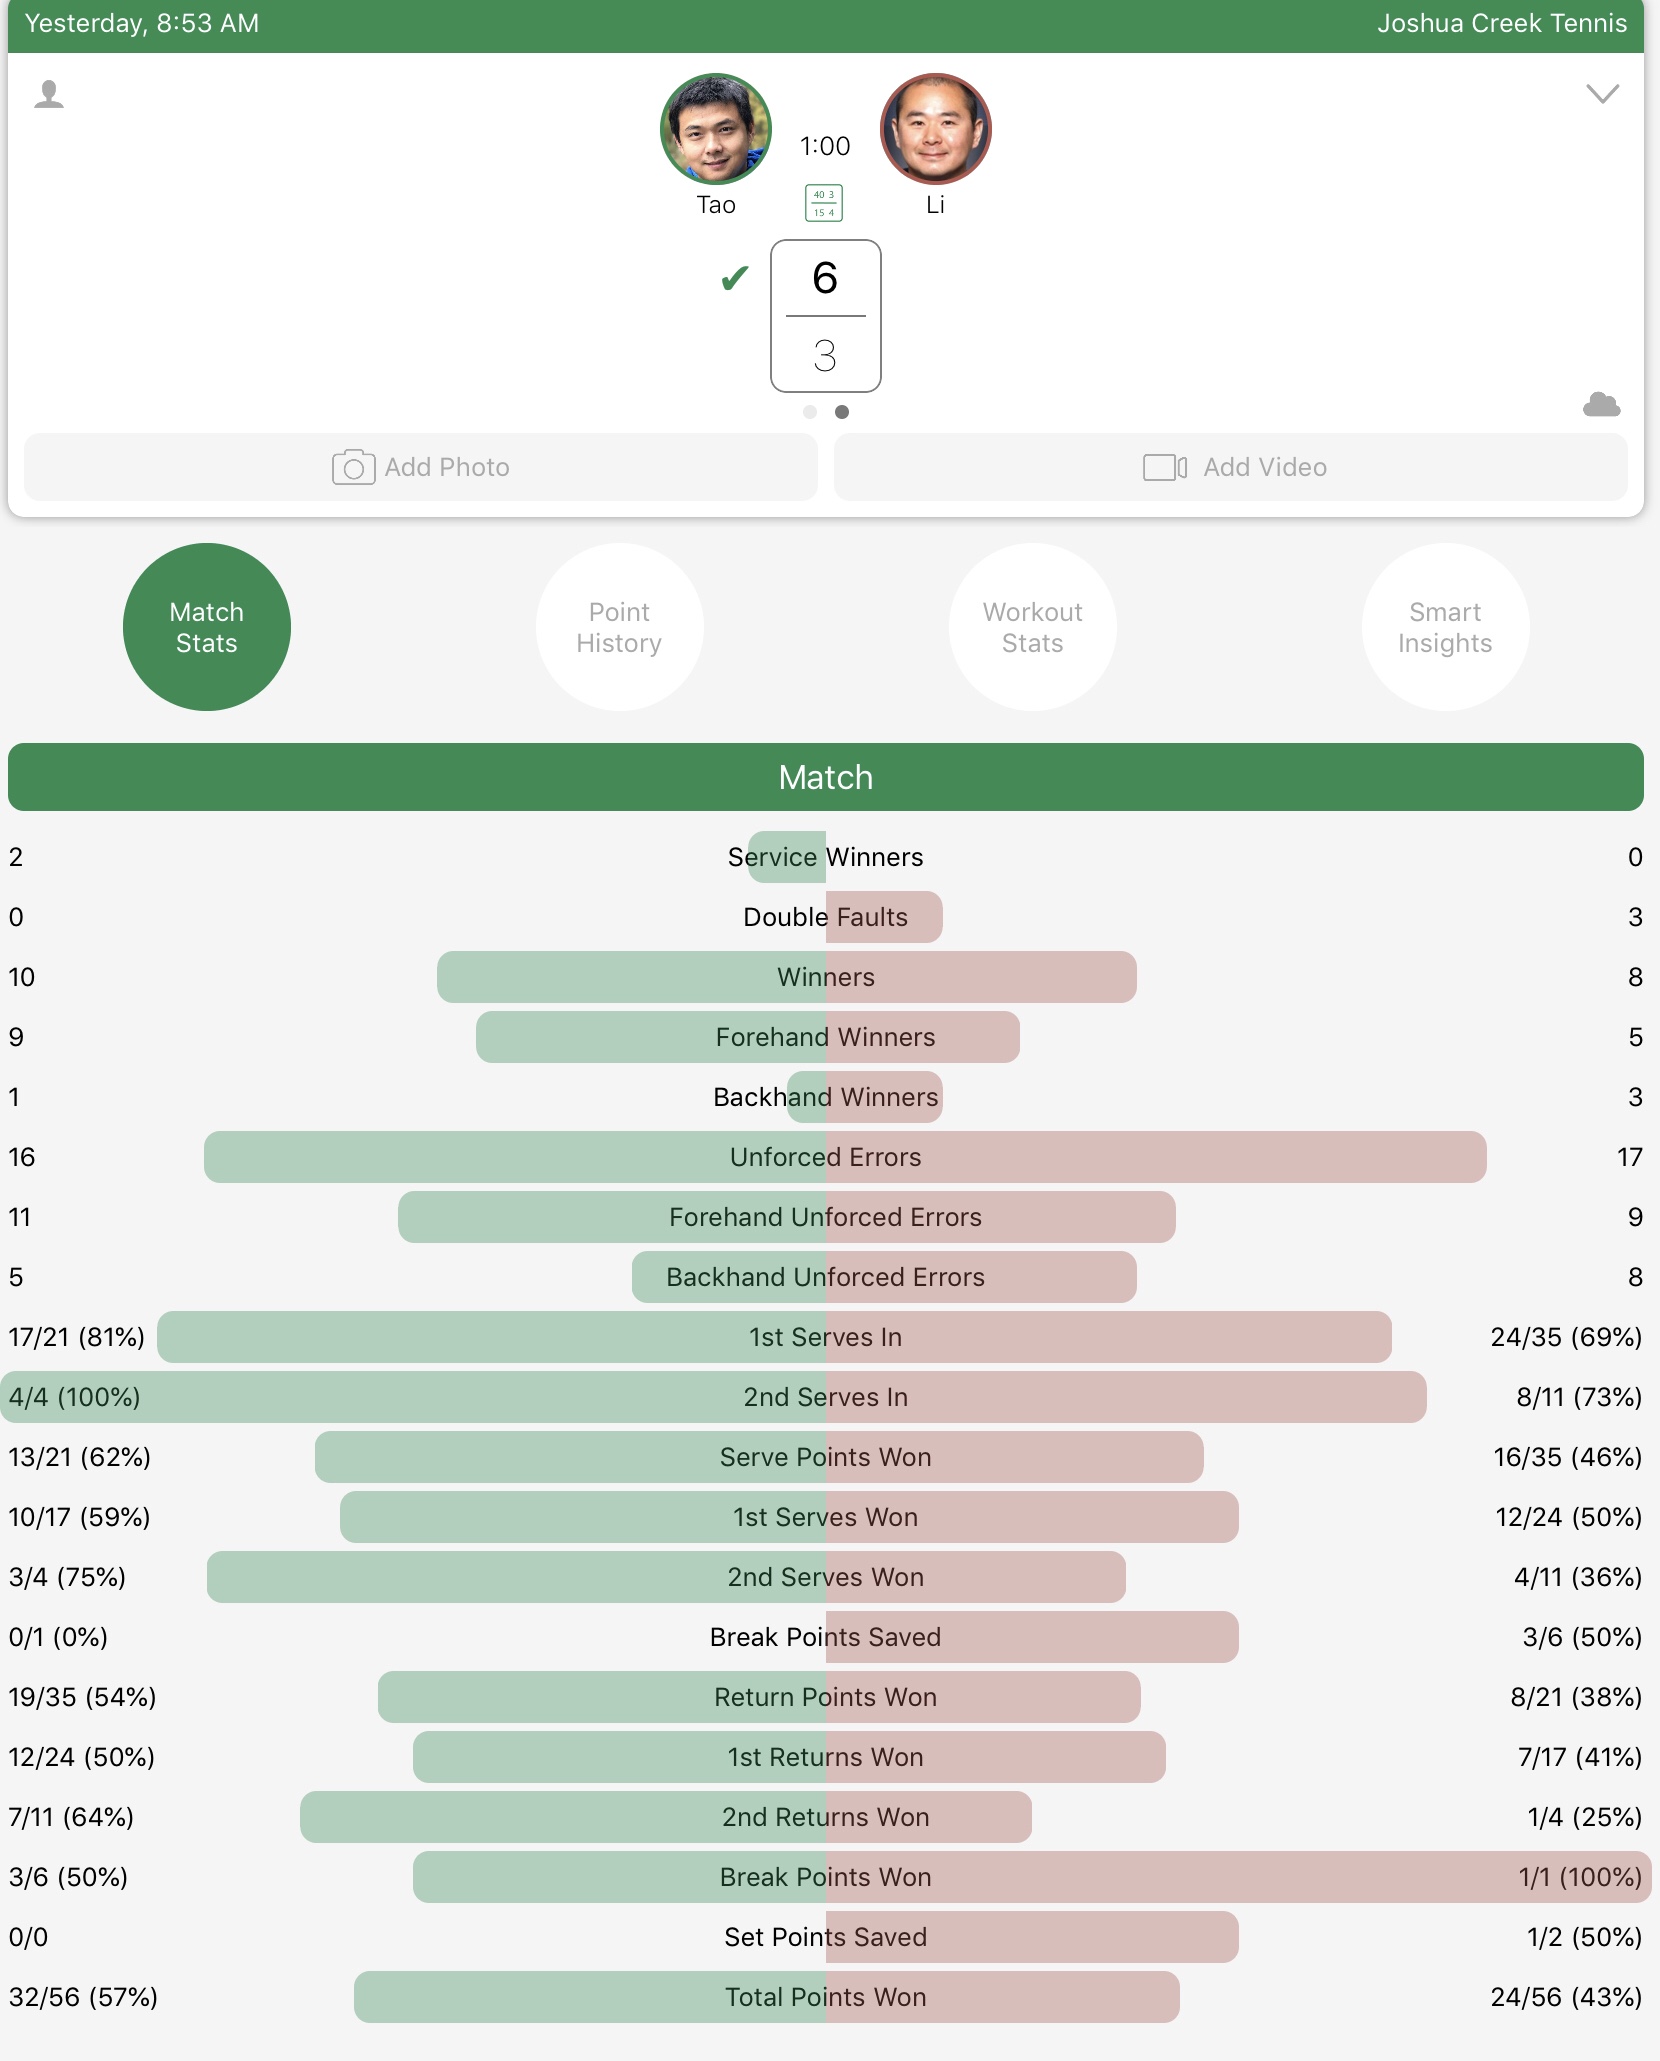
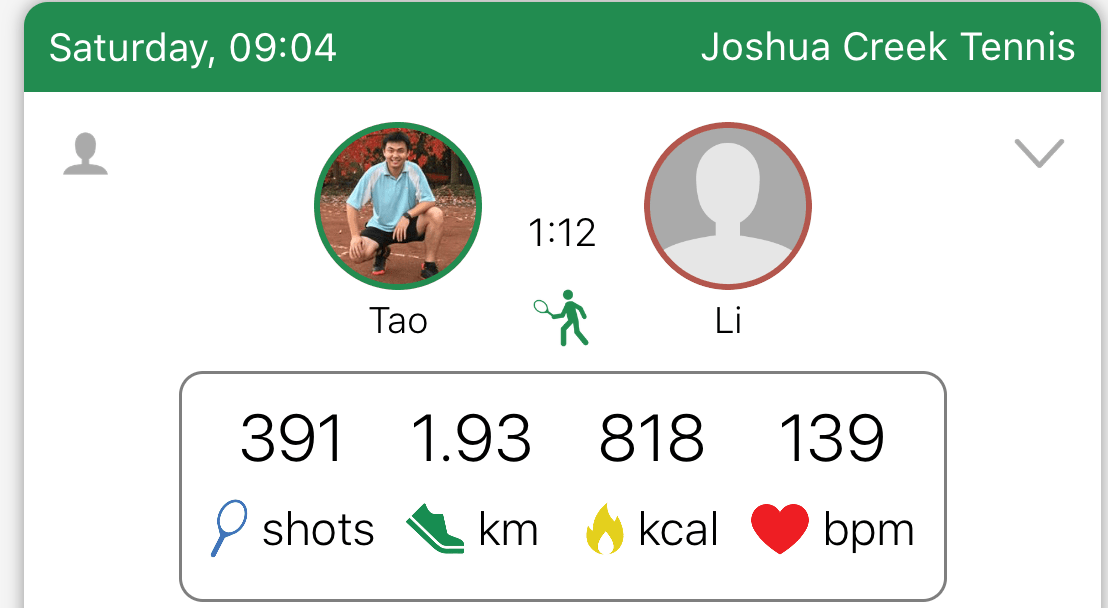
I also joined a new tennis club, and actively participated in the ladder game. After playing over 10 games using the newly improved SwingVision app (most recent version 7.2), I have found an effective way of generating a 10-15min highlight video of ALL POINTS played in a 1hr ladder match.
The video highlight generated is overlayed with the match score, recorded real time by Apple Watch. This makes it enjoyable to watch for friends and families, because it feel like watching a Pro match highlight between Federer and Nadal.
The finished video is invaluable. It can be used for:
Analyze point by point game performance to look for area of improvements
Share with your partner and other audiences
Store and archive in your personal library for later usage
Over the past few years I have read 15-20 books on a yearly basis, with majority of them are related to analytics. Few disappointed me in practicality, even less excelled at readability.
This book is different. It feel like reading a novel – the joy of reading its own narratives, or in other words “teaching you how to tell stories” kept attracting me to read a few pages every day. I don’t have lots of free time at this stage of my life. Reading a few pages can often makes me laughed, feel resonated, or more importantly inspired to work on my craft.
More focus on data and narratives
The “data visualization” area is already quite crowded. I have personally read over 10 of them, written by authors from various of backgrounds.
In real work environment, it is quite difficult to apply some of the principles like “keeping data ink ratio high”. Here is an example: Analytics piece were often part of the “master” slides presenting to executive on regular basis. When all other 7 pieces from varies departments were jamming the information into busy slides, the pressure to align became way to high to try out something different.
That is what I particularly like the fact that, this book spent 2/3 of the contents on the two pieces that were not considerable less popular, but equal if not more important.
The first piece is data. The book provides both framework and concrete examples showing how we can analyze the data with the purpose of generating “insights” from raw data-set. The definition of “insights” in the book were coincidentally used from Avinash Kaushik’s famous “so what” interview
Why should your audience care?
What should they do about it?
What is the potential business impact?
Recently, I experienced it first hand that a C-suite executive demanding the answers of these questions in a meeting. The meeting didn’t went well, luckily I wasn’t the presenter.
The second piece is narratives. I heard this concept a lot, and this book provided the most clear instruction on how to build the narratives:
Firstly it has introduced a framework called Data Storytelling Arc:
Setting the hook
Rising insights
Aha Moment
Solution and next step
This is not entirely brand new concept, as similar framework has been introduced in the past. What’s particular innovating to me is the “story point” concept. The story points are essentially the “meat” that can be built on top of the 4 points frameworks. Some of the typical story points includes – change over time (time series analysis), relationship, intersection (comparison), project forward (forecasting), drill down and zoom out, and lastly cluster and outlier. Lots of these are already familiar to me, but putting them under the umbrella of story points makes those analysis purposeful.
Missing pieces
It might be trivial and a low percent of user will actually check out the sheets/charts used and companion material listed by the book. But when I attempt to check it out, it was not accessible as expected. I was forced to submit an form with an message like this – that is mildly disappointing.
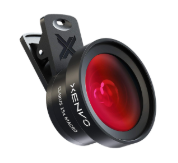
I received a special gift from my lovely wife during last year’s Christmas.
It is an add-on lens to put on my iPhone to capture more area. It is particularly useful when recording the tennis match from the baseline, because my iPhone doesn’t have a wide angle lens built-in so it doesn’t capture enough area.
To be honest, originally I was just planning to try out the new AI feature offered by SwingVision app. After using it for over 6 weeks and multiple rounds of trial and errors, post game video has become an essential piece of my tennis life. The app itself is still in its infancy stage with all kinds of limitations, however I can see a lot of potential in this area.
Back by popular demand, this blog post continues diving into making use of the data we captured via Swing App from my Apple Watch.
If you are new to the tennis tracking via apple watch, please check out my introductory blog post.
If you are interested in tennis, and subscribed to the Pro version of the Swing App, you will be able to export all the data to a clean Excel format. That is really cool, but what can you do about it?
In this blog, I will share my experience of playing and analyzing the raw data for over 30 hrs over the past few months. Hopefully by reading this article, you will have slightly more incentive to make use of the data, after your hard fought game and logging via Apple Watch.
We will cover the following three topics with hands-on examples:
Basic data cleaning and data modeling for the required analysis using Excel build-in feature
How to breakdown the first and second serve performance with speed and distribution
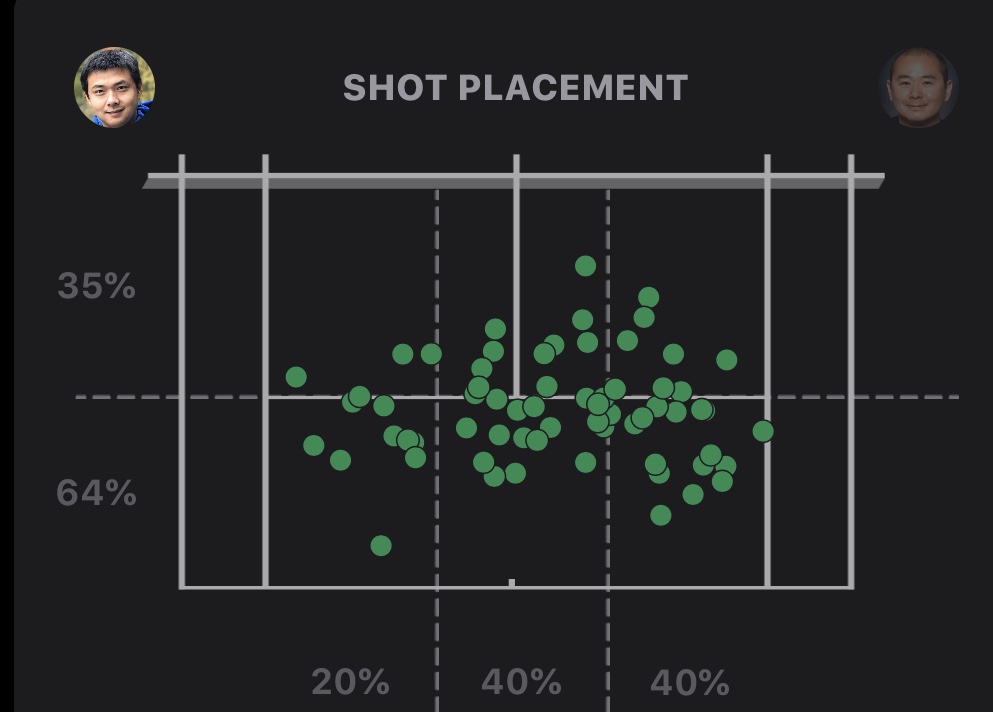
How to breakdown the short, medium and long rally on game points
During the winter of 2018-2019, I was able to take my tennis tracking journey into a new level. By now most of my tennis hitting partners are calling me a “data nerd”, clicking my watch like crazy during the game. But when I show them the stats after the game, they all (seem to be) impressed.
I did the following two new things in particular:
Used the “Point by Point + ” score tracking in the Swing App to track all the points I have played. In total, I tracked 18 matches over the last 4 month, all of them were single matches and played in 1 hour.
Exported the captured data into spreadsheets. By analyzing the data set, I was able to identify some of the limitations, as well as some opportunities to further enhance the analytics experience.
Before we dive in, if you are interested in knowing the tennis tracking tools and methodology, or a high-level overview, you can check my 1st blog post of this series: Tennis tracking after 18 month of usage. Or if you prefer to track drills instead of match, you can check out my last post on advanced tennis shots tracking.
It has been 9 months since I first shared experience to track tennis performance with Apple Watch. Backing up by popular demand(Surprised so many visitors found this blog from search engine all over the world), I’d like to take it further with a more in-depth review, of my own experience tracking and analyzing my tennis workout with the Swing app.
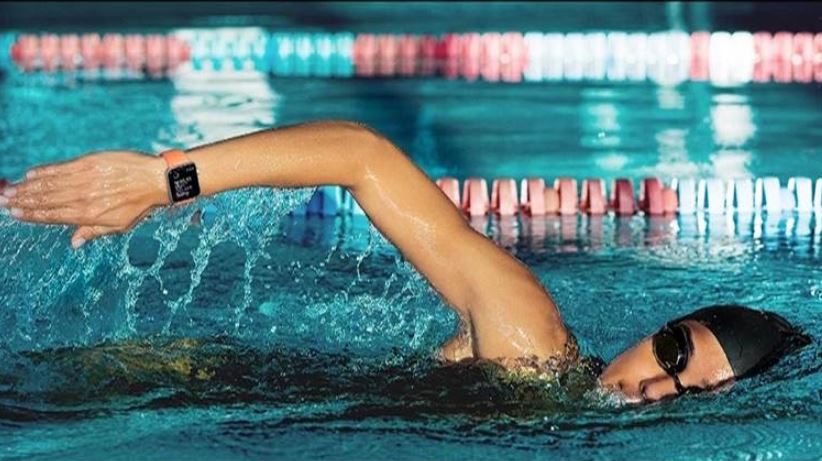
This blog post is aiming to provide a step-by-step guide to perform advanced analytics on swimming data, captured by Apple watch. Microsoft PowerBI and Python on Jupyter Notebook are the primary tools to prepare, analyze and visualize the data.
You will learn how to export the workout data efficiently to your PC, make necessary data transformation, and understand what metrics and dimensions are available. Then I will walk you thru how to analyze the data to answer typical questions related to why certain behaviors happened. You will then see my preliminary attempt to use advanced analytics tools to predict future swimming performance.
Most importantly, you will find quite a few reference articles related to this topic, hopefully fulfilling your intellectual curiosity.
It is also the #3 articles of a series, the previous articles can be found here: