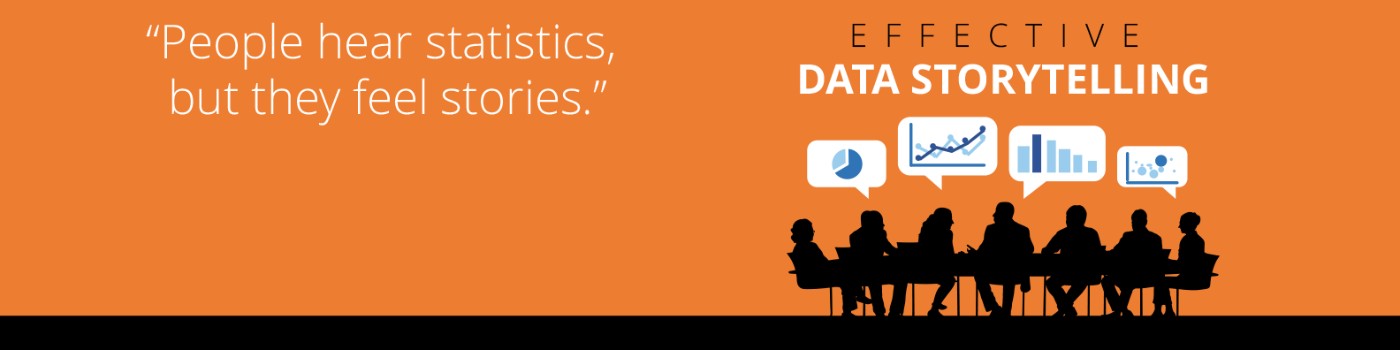
Book review – Effective data storytelling by Brent Dykes
Nothing feels better than finding a gem at the beginning of 2020, from the current world of information overload.
The gem I am referring to is the this new book called “Effective Data Storytelling” – How to drive change with data, narratives and visuals from Brent Dykes
It amazed me in the following area:
Readability
Over the past few years I have read 15-20 books on a yearly basis, with majority of them are related to analytics. Few disappointed me in practicality, even less excelled at readability.
This book is different. It feel like reading a novel – the joy of reading its own narratives, or in other words “teaching you how to tell stories” kept attracting me to read a few pages every day. I don’t have lots of free time at this stage of my life. Reading a few pages can often makes me laughed, feel resonated, or more importantly inspired to work on my craft.
More focus on data and narratives
The “data visualization” area is already quite crowded. I have personally read over 10 of them, written by authors from various of backgrounds.
In real work environment, it is quite difficult to apply some of the principles like “keeping data ink ratio high”. Here is an example: Analytics piece were often part of the “master” slides presenting to executive on regular basis. When all other 7 pieces from varies departments were jamming the information into busy slides, the pressure to align became way to high to try out something different.
That is what I particularly like the fact that, this book spent 2/3 of the contents on the two pieces that were not considerable less popular, but equal if not more important.
The first piece is data. The book provides both framework and concrete examples showing how we can analyze the data with the purpose of generating “insights” from raw data-set. The definition of “insights” in the book were coincidentally used from Avinash Kaushik’s famous “so what” interview
- Why should your audience care?
- What should they do about it?
- What is the potential business impact?
Recently, I experienced it first hand that a C-suite executive demanding the answers of these questions in a meeting. The meeting didn’t went well, luckily I wasn’t the presenter.
The second piece is narratives. I heard this concept a lot, and this book provided the most clear instruction on how to build the narratives:
Firstly it has introduced a framework called Data Storytelling Arc:
- Setting the hook
- Rising insights
- Aha Moment
- Solution and next step
This is not entirely brand new concept, as similar framework has been introduced in the past. What’s particular innovating to me is the “story point” concept. The story points are essentially the “meat” that can be built on top of the 4 points frameworks. Some of the typical story points includes – change over time (time series analysis), relationship, intersection (comparison), project forward (forecasting), drill down and zoom out, and lastly cluster and outlier. Lots of these are already familiar to me, but putting them under the umbrella of story points makes those analysis purposeful.
Missing pieces
It might be trivial and a low percent of user will actually check out the sheets/charts used and companion material listed by the book. But when I attempt to check it out, it was not accessible as expected. I was forced to submit an form with an message like this – that is mildly disappointing.

Closing comment
It is a great book. You should check it out
Brent Dykes
Tom,
I’m glad you enjoyed the book. I’m working with the publisher on fixing the website content issue. In the meantime, if you’d like to get access to the resource files, please shoot me your email address.
Cheers,
Brent.
Brent Dykes
The publisher’s webpage is now fixed, but you do have to register with Wiley.com to get access to the files.
Tom Tao
Thanks Brent. Appreciate you on top of it.