The first real ladder game against a 5.0 player
What happens today (fact)
- This is my third ladder match at Milton tennis club. My opponent is Andrew. He ranked two spot(#2) above me(#4).
- The weather wasn’t great. We almost cancelled the match due to the rain earlier. Realizing our upcoming schedule might not fit for another match, both of us made effort to get to the court and finish the ladder match.
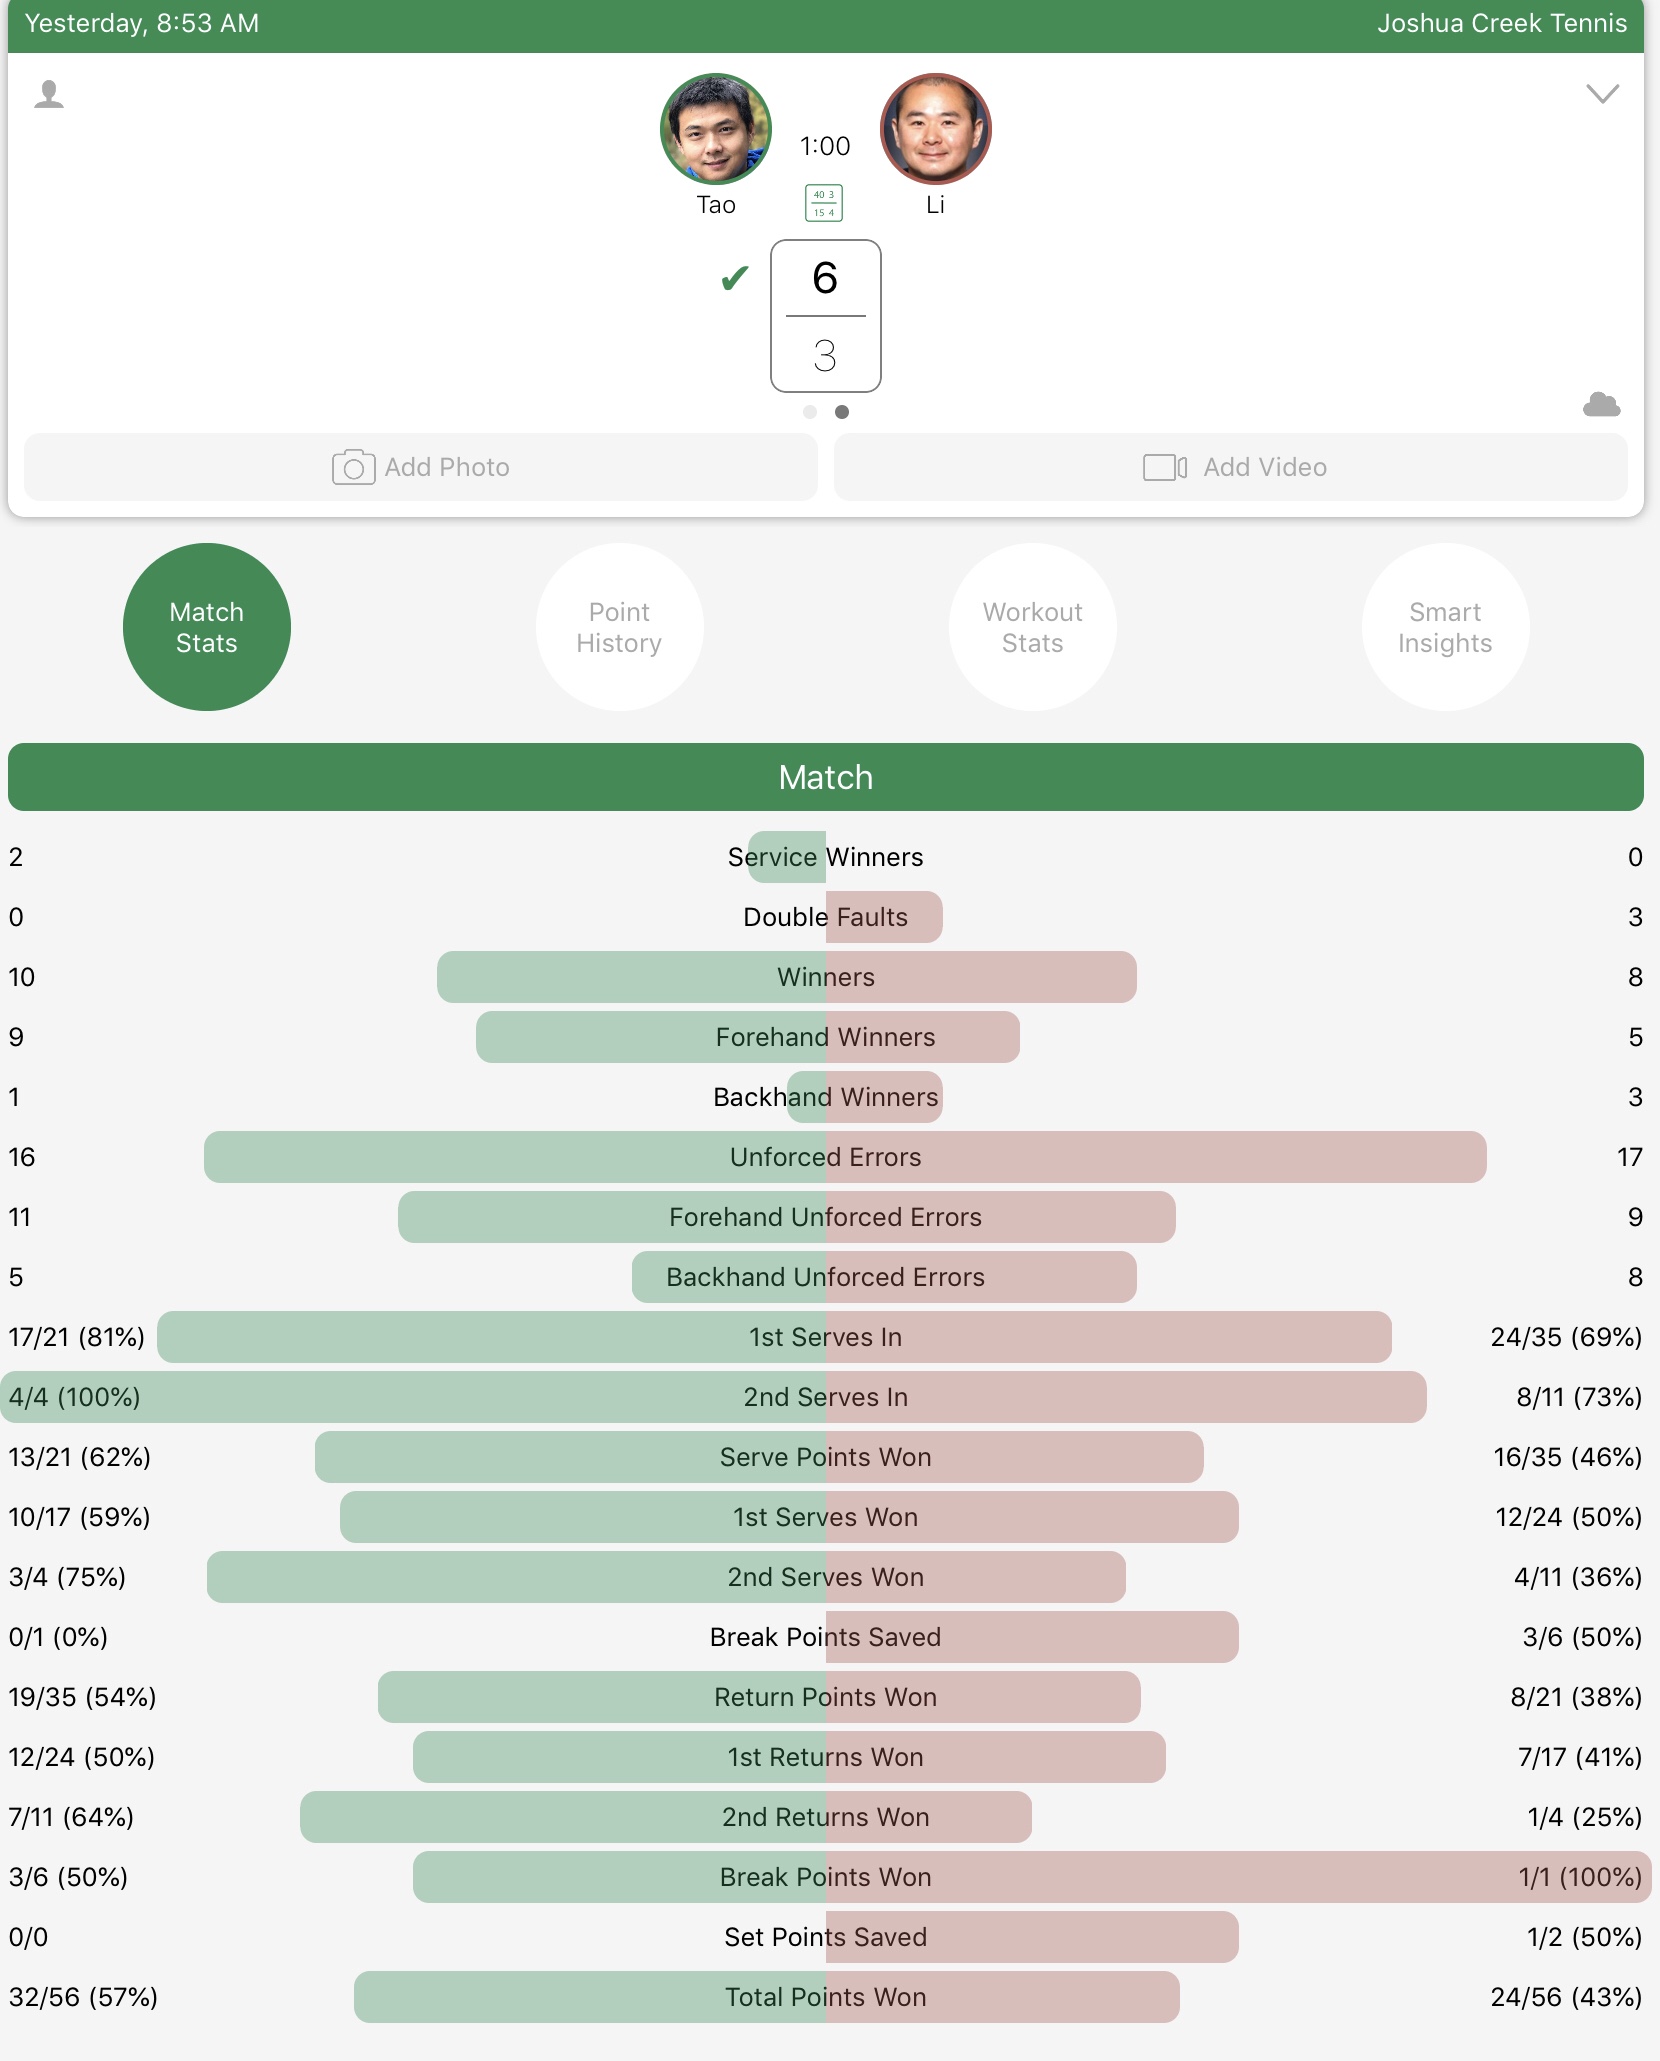
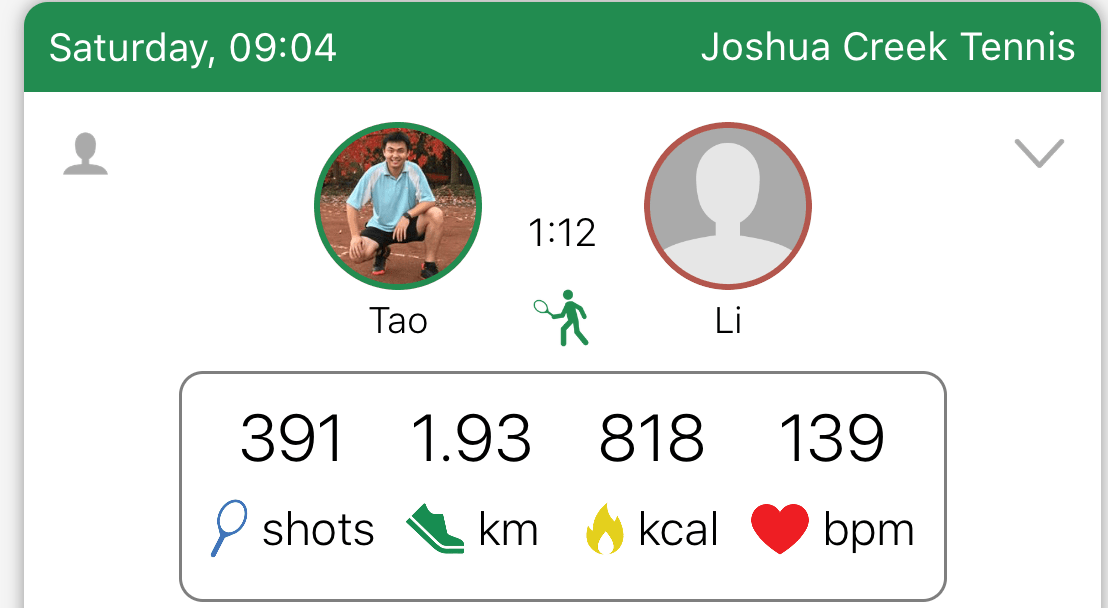
- The result is one-sided. I lost by 1:6. We chose to use the 6-game instead of the 8-game pro set due to the weather delay. The game only lasted 25 minutes.
- Total points played: 45. I won 38% of them (17 of 45).
- I served quite well today (88% first serve in) and had 5 service winners.
My hot takes
- I lost today because I feel my opponent is the better player
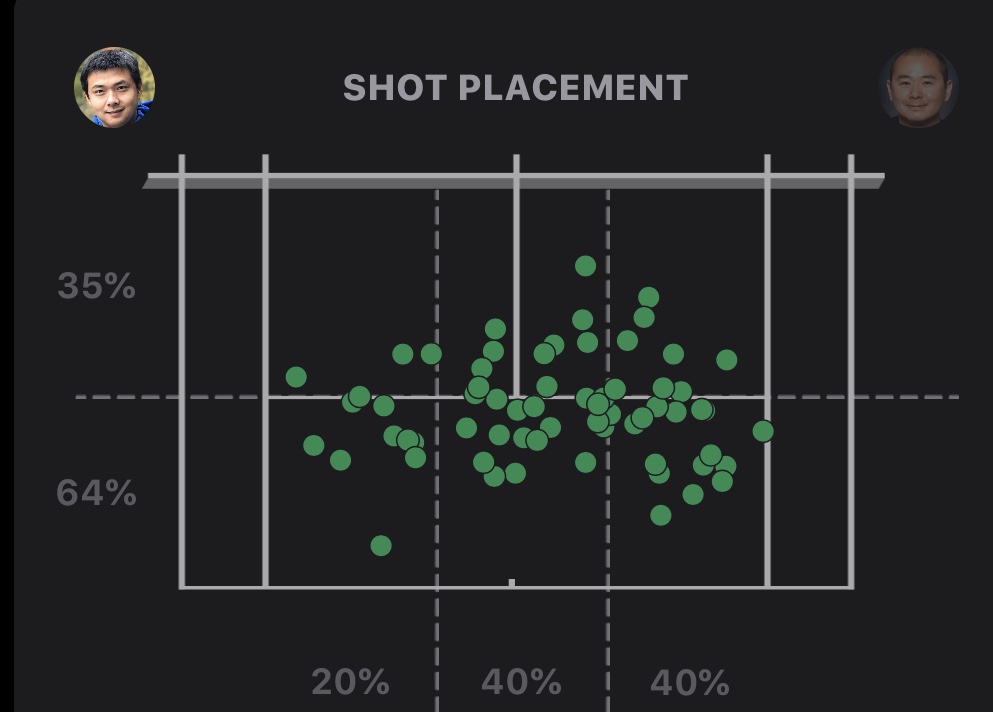
- I wasn’t able to match my opponent’s intensity & shot speed. When feel pressured and rushed, my rallies were often short. This gave my opponents too many chances to move forward and attack inside out. This momentum keeps going and I was in a hole 0-4 very quickly.
- My word playing at Milton’s Court 1 (showroom court) is 0 for 3 so far. (lost to Henry, Suriyan, and now Andrew)I should avoid playing at this court for important matches in the future 🙁
- When holding break points twice, I chose to play defence and let my opponent dictate the points. This works with ppl with/below my level, not today. When losing those two precious games, I lost my momentum and my confidence
My post-game analysis after watching the video from SwingVision-
- I lost today because I chose the wrong tactics – I played too safe and bet my opponents would beat himself with unforced errors. In my experience, It never worked when playing against opponents with both skills & experience.
- My defense wasn’t up to my standard. There are a few times when Andrew started to attack inside-out, and my returning shots were immediately falling short. That makes me an easy target to get “finished” , and this led to the quick drop of my confidence.
- Even though my service was solid, I wasn’t hitting enough on his backhand, particularly for my 2nd serve. As a result, he can attack my 2nd serve with ease, and got 2 winners out of my first two service games. That also led to me having doubt of my abilities in the match.
Next steps
- In order to work on my aggressiveness, the slinger bag I bought a few months ago is suitable to work on “techniques”.
- Mental part would be more difficult – essentially how can I feel more “confident” to generate my own pace ? I guess the only thing I can do is to play against players slightly above my skill level this summer.