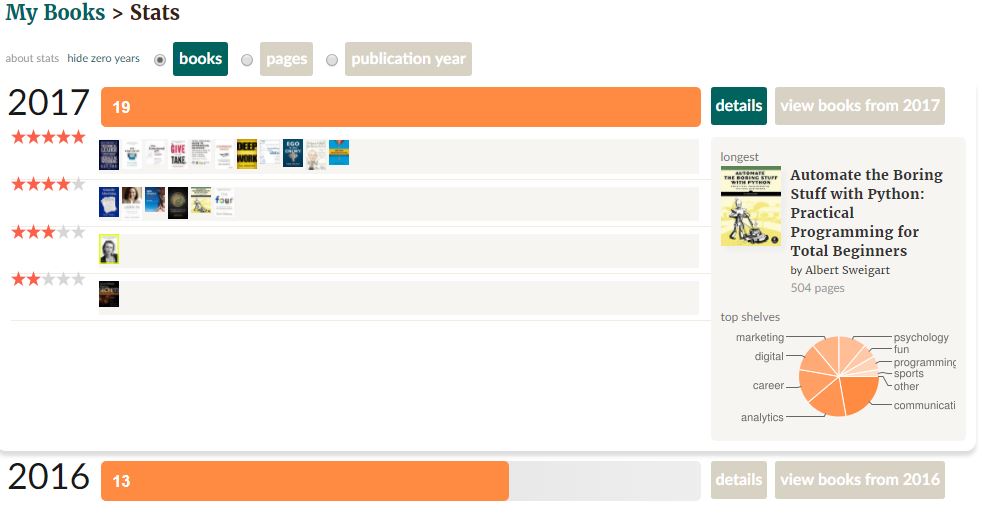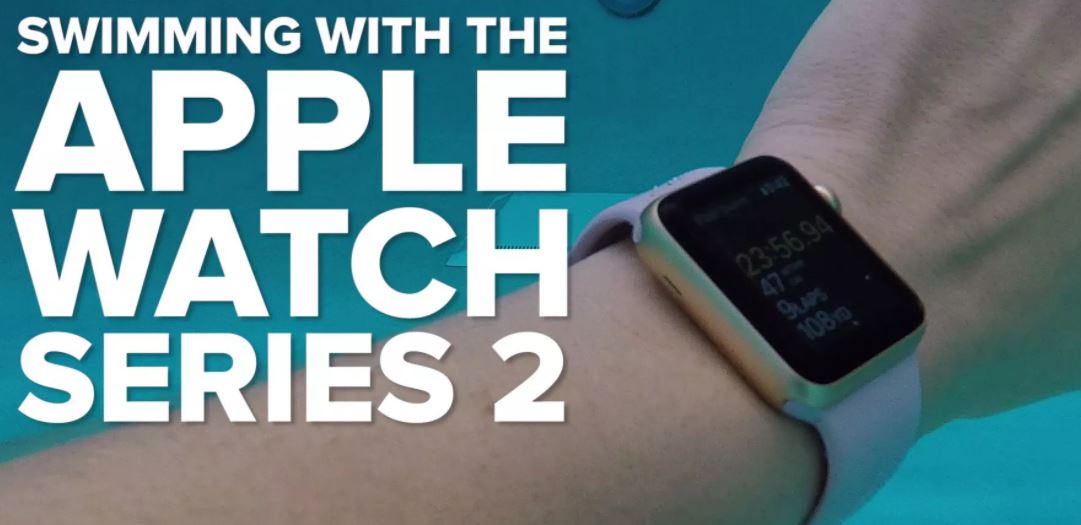
Advanced Analytics with Swimming data from Apple Watch
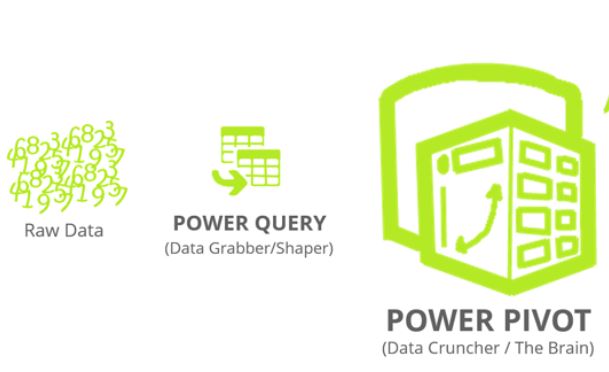
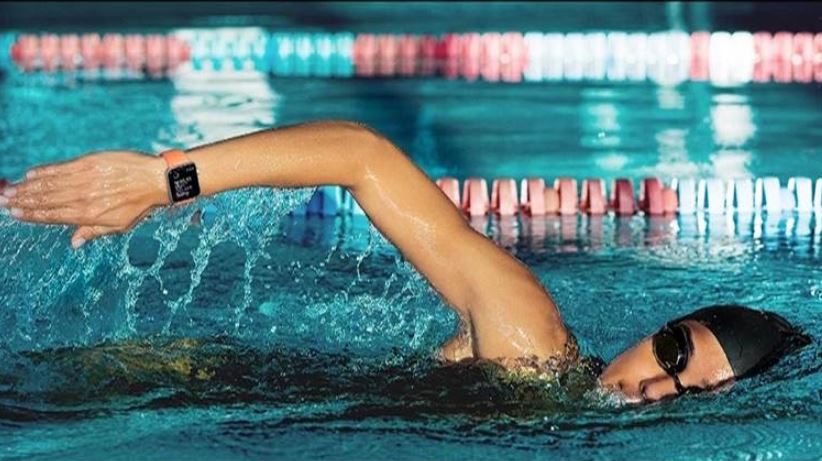
This blog post is aiming to provide a step-by-step guide to perform advanced analytics on swimming data, captured by Apple watch. Microsoft PowerBI and Python on Jupyter Notebook are the primary tools to prepare, analyze and visualize the data.
You will learn how to export the workout data efficiently to your PC, make necessary data transformation, and understand what metrics and dimensions are available. Then I will walk you thru how to analyze the data to answer typical questions related to why certain behaviors happened. You will then see my preliminary attempt to use advanced analytics tools to predict future swimming performance.
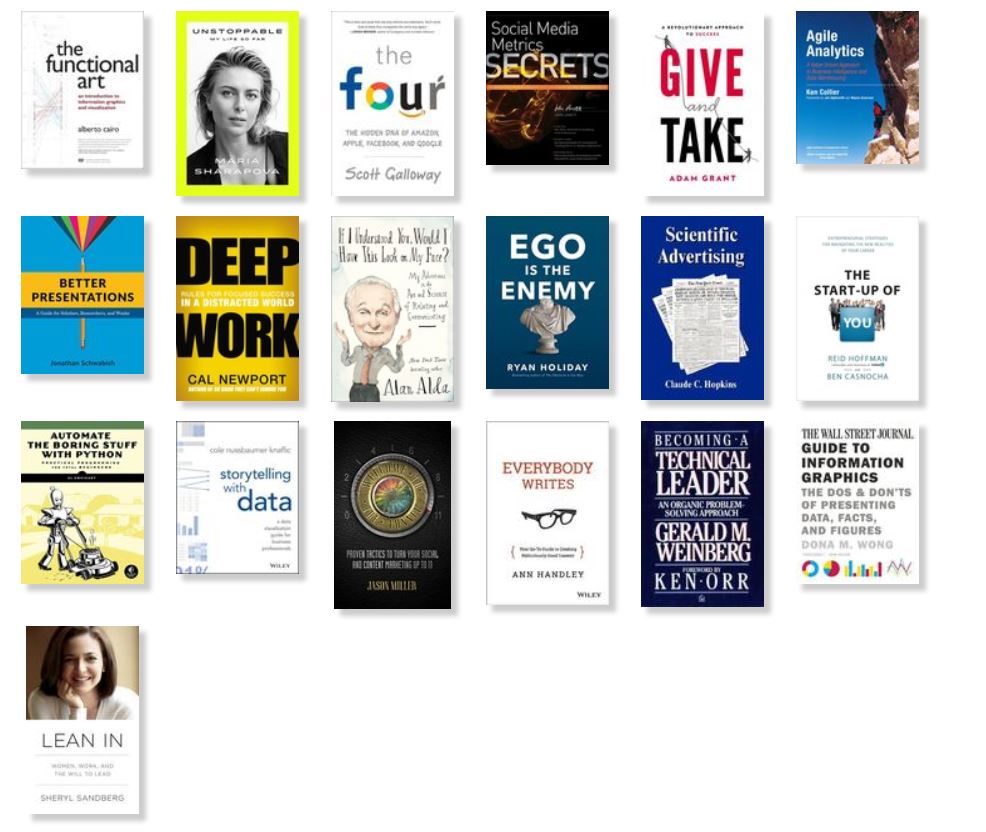
Most importantly, you will find quite a few reference articles related to this topic, hopefully fulfilling your intellectual curiosity.
It is also the #3 articles of a series, the previous articles can be found here:
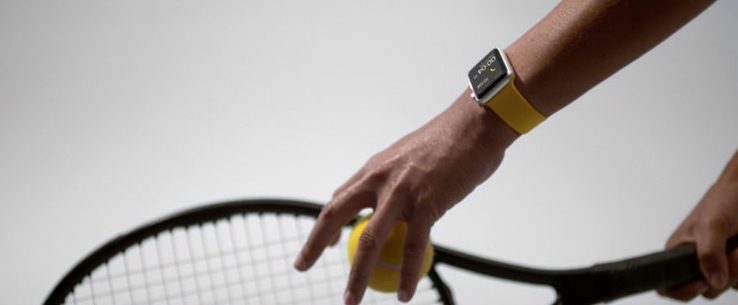
#1: How to use Apple Watch to monitor and improve swim performance
#2: Improving swimming performance with Apple Watch(WatchOS 4)